
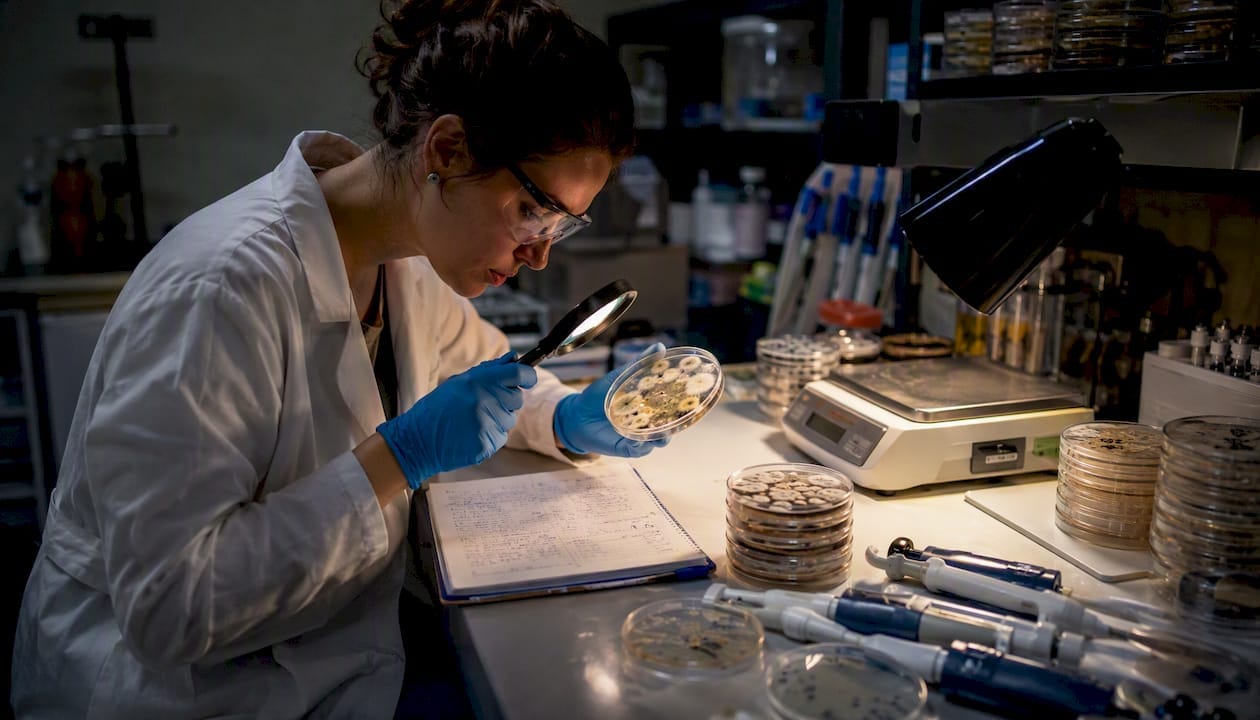
Direct biomass assays such as dry cell weight (DCW) and ergosterol extraction are the most accurate options for absolute biomass quantification. Optical density (OD) and image-based analysis are fastest for time-course screening, provided you calibrate them to a direct measure first. The common fungal growth measurement methods used in research laboratories today fall into six broad classes, each suited to a different combination of substrate type, throughput requirement, and accuracy target.
At a glance: which method fits your experiment?
- Dry cell weight (DCW): best for liquid cultures where absolute biomass is the goal; slow but the gold standard for accuracy.
- Ergosterol assay: preferred for solid or embedded substrates where physical mycelium separation is impractical; also distinguishes surface from invasive growth.
- Chitin quantification: useful when ergosterol is unreliable (e.g., stressed or aged cultures); slower and less common than ergosterol.
- Radial growth / colony diameter: the quickest phenotype screen on agar; reports surface expansion only, not density or biomass.
- Optical density (OD) / microplate spectrophotometry: high-throughput time-course monitoring in liquid culture; requires isolate-specific calibration against DCW and fails for pellet-forming morphologies without homogenisation.
- Haemocytometer counts / CFU plating: quantifies spore concentration or viable propagule number; limited for filamentous forms due to clumping.
- Automated image analysis (ImageJ/Fiji, CellProfiler, Fungal Feature Tracker, IncuCyte): extracts hyphal length, area, branching, and fractal dimension at scale; best validated against a direct measure periodically.
Three practical selection rules cover most experimental decisions: (1) use DCW or ergosterol for absolute biomass in liquid or embedded substrates; (2) use radial growth for rapid phenotype screening on agar; (3) use OD or image analysis for high-throughput time courses, always with prior species-specific calibration.
Table of Contents
- How should you choose between direct, indirect, and nondestructive approaches?
- How do you measure fungal growth on agar and solid substrates?
- How do you measure fungal growth in liquid cultures?
- How do ergosterol and chitin assays quantify fungal biomass?
- How do haemocytometer counts and CFU plating work for fungi?
- Which automated imaging tools extract the most useful fungal metrics?
- How do you calculate specific growth rate, doubling time, and radial growth rate?
- What practical steps keep your measurements reproducible and error-free?
- Side-by-side comparison of the main measurement methods
- Key takeaways
- Useful sources
- FAQ
How should you choose between direct, indirect, and nondestructive approaches?
Every fungal growth measurement either counts or weighs something real (a direct measure) or uses a proxy signal that correlates with growth (an indirect measure). Knowing which category your method falls into shapes how you interpret results and where errors creep in.
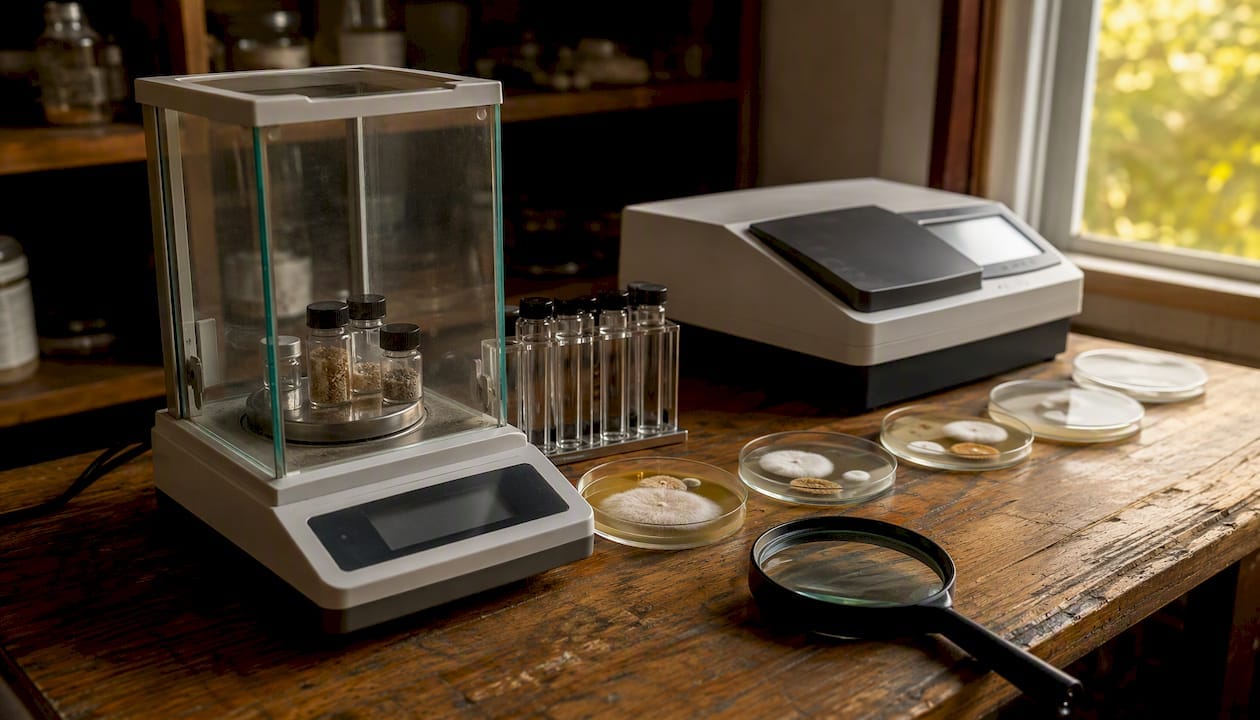
Direct measures include DCW, ergosterol content, chitin content, and CFU counts. Each quantifies something physically present in the sample. Indirect measures include OD, fluorescence intensity, and image-pixel intensity. They correlate with biomass but are sensitive to morphology, pigmentation, and culture geometry.
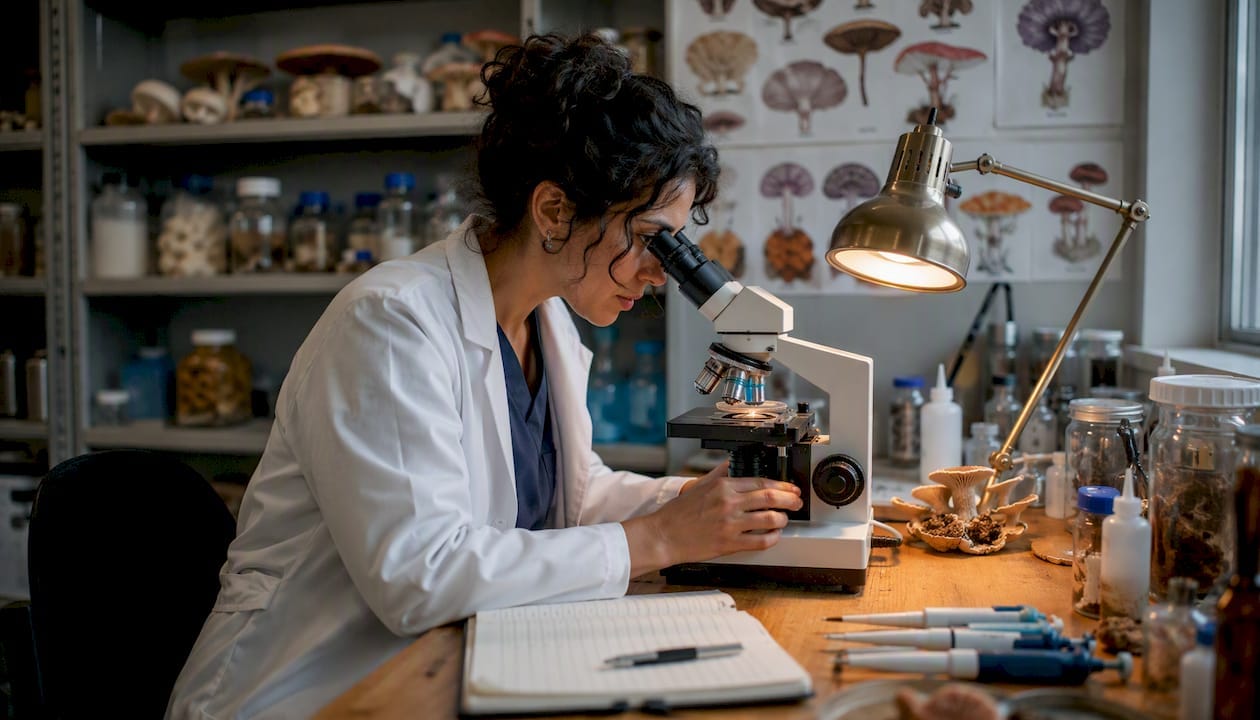
The second axis is destructive versus nondestructive. DCW, ergosterol extraction, and chitin assays all consume the sample. OD readings on a microplate, colony photographs, and IncuCyte time-lapse imaging leave the culture intact for continued monitoring. For kinetic experiments, nondestructive methods are often the only practical choice.
A quick decision checklist:
- Substrate type: liquid culture supports OD and DCW; solid or embedded substrates need ergosterol, chitin, or image analysis.
- Required accuracy: absolute biomass needs DCW or ergosterol; relative comparisons can use OD or radial growth.
- Throughput: screening dozens of isolates favours microplate OD or automated imaging; detailed mechanistic studies can afford DCW.
- Equipment available: spectrophotometer and balance cover most methods; HPLC is needed for validated ergosterol quantification.
- Time to result: OD and imaging give results in minutes; DCW requires overnight drying; ergosterol extraction typically takes several hours.
Indirect assays are limited by structure and by non-cellular coloured substances; careful preprocessing and calibration mitigate many of those issues, but they do not eliminate them.
Pro Tip: Always build a method-specific standard curve for the species and culture morphology under study before committing to an indirect method. An OD-versus-DCW curve generated on one isolate is not transferable to another without validation.
How do you measure fungal growth on agar and solid substrates?
Solid-media measurements are the most accessible entry point in fungal biology, requiring little more than a camera, a ruler, and a consistent incubation setup. The challenge is that they capture surface expansion, not the full picture of what the mycelium is doing inside the substrate.
Radial growth and colony diameter
Radial expansion on agar is a widespread, straightforward method, but it reports surface expansion in two dimensions and misses density or invasive 3D growth. For most phenotype screens, that limitation is acceptable.
Protocol steps:
- Prepare plates with a standardised agar depth (typically 20–25 mL per 90 mm Petri dish) and allow them to set and dry for at least 30 minutes.
- Inoculate centrally with a standardised plug (5 mm diameter) or a defined spore suspension volume.
- Seal plates with Parafilm or breathable tape and incubate at a controlled temperature.
- Measure two perpendicular diameters per colony at each time point using a digital calliper or image analysis; record the mean.
- Photograph plates from a fixed height under consistent lighting at each measurement interval.
- Report radial growth rate as mm day⁻¹ by plotting mean radius against time and taking the slope of the linear phase.
Sampling frequency depends on growth rate: fast-growing species such as Trichoderma may need daily measurement; slower species can be measured every 48–72 hours. Use a minimum of three biological replicates per treatment.
Pro Tip: Space inoculation points at least 30 mm from the plate edge and at least 50 mm from neighbouring colonies. Edge effects and colony competition alter growth rate and morphology, introducing systematic bias that replicates cannot correct.
Mycelial area from images
For irregular colony shapes, area measurement from photographs is more informative than diameter. Capture images under a copy stand with a calibration ruler in frame. In ImageJ/Fiji, set the scale from the ruler, convert to 8-bit, apply a threshold to separate mycelium from background, and use Analyse Particles to extract area in mm². Normalise area measurements by inoculum size or starting plug area to make comparisons fair across experiments.
When the substrate prevents separation
When mycelium is embedded in wood, grain, or composite materials, physical separation is impractical. Ergosterol and chitin assays are the preferred alternatives for quantifying fungal biomass in complex solid substrates. Sample preparation for heterogeneous substrates involves freeze-drying or oven-drying to a constant weight, grinding to a fine powder, and then proceeding with solvent extraction. Spatial sampling (multiple cores from different depths) is necessary to capture the full growth profile.
| Dimension | Radial growth | Mycelial area (image) | Ergosterol / chitin |
|---|---|---|---|
| Sample type | Solid agar | Solid agar / surface | Solid / embedded |
| Throughput | High | Medium | Low |
| Accuracy / directness | Indirect (2D proxy) | Indirect (2D proxy) | Direct biomarker |
| Destructive | No | No | Yes |
| Equipment | Calliper or camera | Camera + ImageJ | Balance, HPLC or spectrophotometer |
| Time to result | Minutes | Minutes | Several hours |
| Output units | mm day⁻¹ | mm² | mg ergosterol g⁻¹ substrate |
How do you measure fungal growth in liquid cultures?
Liquid culture methods range from the laborious but definitive (DCW) to the rapid and scalable (microplate OD). Choosing between them depends on whether you need an absolute biomass figure or a relative comparison across many conditions.
Dry cell weight
DCW remains the benchmark for accuracy in liquid cultures, but it is time-consuming because it requires centrifugation or filtration and overnight drying.
Protocol:
- Withdraw a defined sample volume (typically 5–10 mL) at each time point.
- Filter through a pre-weighed 0.45 µm membrane filter or centrifuge at 5,000 × g for 10 minutes and discard the supernatant.
- Wash the pellet or filter cake twice with distilled water to remove medium salts.
- Dry at 80°C for at least 24 hours (or until constant weight is reached).
- Cool in a desiccator and weigh immediately.
- Calculate: DCW (mg mL⁻¹) = (dry filter + biomass weight − dry filter weight) / sample volume.
Use at least three biological replicates and include a blank filter processed identically without biomass.
Pro Tip: For pellet-forming species, homogenise the culture with an Ultra-Turrax or similar disperser before sampling to break pellets and obtain a representative aliquot. Without homogenisation, subsampling error can exceed the biological signal you are trying to detect.
Packed mycelial volume and wet weight
Packed mycelial volume (centrifuge the culture and read the pellet volume) and wet weight are faster than DCW but substantially more variable because water retention differs with morphology and centrifugation conditions. Reserve these for rough screening or for situations where drying facilities are unavailable.
Optical density and microplate spectrophotometry
OD can monitor filamentous fungi in liquid culture but is an indirect proxy that must be calibrated against DCW for each isolate and morphology. For dispersed growth, OD at 600 nm is typically linear up to approximately 0.3–0.4 absorbance units; beyond that, the relationship flattens and dilution is required. Pellet-forming cultures produce unreliable OD readings without prior homogenisation.
Microspectrophotometry in microplate format provides linear growth capture and enables construction of standard curves to estimate biomass from absorbance, making it practical for screening large numbers of conditions simultaneously.
Building an OD-versus-DCW calibration curve:
- Grow the target isolate in liquid medium to several biomass densities spanning the expected experimental range.
- At each density, measure OD (in triplicate) and immediately collect a parallel sample for DCW determination.
- Plot OD on the x-axis and DCW (mg mL⁻¹) on the y-axis.
- Fit a linear regression through the linear portion of the curve; record the equation and R² value.
- Apply the equation to convert future OD readings to estimated DCW, and report the calibration parameters alongside results.
| Dimension | DCW | Wet weight / packed volume | OD (microplate) |
|---|---|---|---|
| Sample type | Liquid | Liquid | Liquid (dispersed) |
| Throughput | Low | Medium | High |
| Accuracy | Direct (gold standard) | Indirect (variable) | Indirect (calibrated) |
| Destructive | Yes | Yes | No |
| Equipment | Balance, oven, filters | Centrifuge | Spectrophotometer / plate reader |
| Time to result | 24+ hours | 30 minutes | Minutes |
| Output units | mg mL⁻¹ | mL or g | OD units → mg mL⁻¹ |
How do ergosterol and chitin assays quantify fungal biomass?
Chemical biomarkers are the method of choice when physical separation of mycelium from substrate is impossible. They work by targeting molecules that are specific to (or highly enriched in) fungal cell walls or membranes.
Ergosterol assay
Ergosterol is the principal sterol in fungal membranes and is largely absent from plant and bacterial material, making it a selective fungal biomarker. Ergosterol assays are preferred over chitin assays for rapid spectrophotometric or HPLC quantification, and ergosterol can distinguish surface-associated from invasive growth if sampled spatially.
High-level extraction protocol:
- Freeze-dry or oven-dry the sample to constant weight; record dry mass.
- Homogenise in a known volume of alkaline methanol (e.g., 0.2 M KOH in methanol) and heat at 80°C for 30 minutes to saponify lipids.
- Extract ergosterol into an organic solvent (typically heptane or hexane); repeat extraction twice.
- Evaporate the combined organic phase under nitrogen and reconstitute in methanol.
- Quantify by HPLC with UV detection at 282 nm, or by spectrophotometry at 282 nm for a simpler setup.
- Validated protocols report recovery controls above 87%; include an internal standard (e.g., cholesterol or a deuterated ergosterol analogue) in every batch.
Report results as mg ergosterol per g dry substrate. Important caveat: ergosterol content per unit biomass changes with culture age, nutrient status, and stress, so reproducible harvest timing and matched growth conditions are non-negotiable when converting ergosterol to biomass.
Chitin quantification
Chitin is a structural polysaccharide in fungal cell walls. Quantification typically involves acid hydrolysis to release glucosamine, followed by colorimetric detection (e.g., the Morgan-Elson or MBTH assay). Chitin is more stable than ergosterol across culture ages and stress conditions, which makes it useful when ergosterol variability is a concern. The trade-off is a more laborious extraction and greater susceptibility to interference from substrate polysaccharides.
When to prefer chitin over ergosterol:
- Aged or stressed cultures where ergosterol content is unpredictable.
- Substrates with high lipid content that complicates ergosterol extraction.
- Studies where cell wall composition is itself the variable of interest.
Other biochemical markers
- Protein content (Bradford or BCA assay): fast and cheap, but substrate proteins cause severe interference in complex media.
- DNA quantification (qPCR): highly specific and sensitive; requires species-specific primers and is best for detecting low-level contamination or mixed communities rather than bulk biomass.
- Cell wall sugars: useful for specific research questions but rarely used as a routine biomass proxy.
Pro Tip: Determine your ergosterol-to-biomass conversion factor using pure mycelium of the target species grown under the same conditions as your experiment. A conversion factor from a different species or growth stage will introduce systematic error that no amount of replication can fix.
How do haemocytometer counts and CFU plating work for fungi?
Counting-based methods quantify spore concentration or viable propagule number rather than total biomass. They are most informative at the start of an experiment (inoculum standardisation) or when viability is the key question.
Haemocytometer spore counts
Protocol essentials:
- Prepare a homogeneous spore suspension by vortexing with glass beads for 30 seconds and filtering through a 40 µm cell strainer to remove hyphal fragments.
- Dilute to a countable range (typically 10⁵–10⁶ spores mL⁻¹ for a standard haemocytometer).
- Load 10 µL under the coverslip and allow spores to settle for 2–3 minutes.
- Count spores in at least five large squares (1 mm²) and calculate: concentration (spores mL⁻¹) = mean count per square × dilution factor × 10⁴.
- Count a minimum of 200 spores total across the grid to achieve acceptable counting precision.
Common errors include counting clumped spores as single units, failing to count spores touching the boundary lines consistently (use the standard rule: count top and left boundaries, exclude bottom and right), and not accounting for dilution factor.
CFU plating
Dilute the spore suspension in a series of 10-fold steps, plate 100 µL of appropriate dilutions onto selective or non-selective agar, and incubate until colonies are countable (typically 48–96 hours depending on species). Count plates with 30–300 colonies. Calculate CFU mL⁻¹ = colony count / (volume plated × dilution factor).
The key limitation for filamentous fungi is clumping: a single CFU may represent one spore or a hyphal fragment carrying dozens of viable nuclei. Report CFU as a relative measure and note this caveat explicitly in methods sections.
Pro Tip: For microscopy-based spore and hyphal imaging, capture images at a fixed magnification with a stage micrometre in frame. This lets you convert pixel measurements to real-world units and compare results across sessions and instruments.
Microscopy for hyphal metrics:
- Tip counts, hyphal length, and branch-point frequency require phase-contrast or brightfield imaging at 10× to 40× magnification.
- Sample at least 20 randomly selected fields per replicate.
- Use ImageJ/Fiji to trace hyphae manually or apply a skeletonisation plugin for semi-automated length measurement.
- Report hyphal extension rate as µm h⁻¹ from time-lapse or sequential fixed-point images.
Which automated imaging tools extract the most useful fungal metrics?
Automated image analysis has transformed high-throughput fungal phenotyping. A deep learning model trained on fungal images can segment growth from background in minutes and scale to 24-well plate assays, reducing labour compared with manual measurement. The challenge is choosing the right tool and validating its outputs against a direct measure.
Common software and their typical outputs:
- ImageJ/Fiji: free, widely used, macro-scriptable. Outputs include area, perimeter, fractal dimension, and skeletonised hyphal length. Best for batch processing of colony photographs with consistent backgrounds.
- CellProfiler: pipeline-based, designed for high-content screening. Handles multi-channel fluorescence images and can be configured for fungal colony segmentation with custom modules.
- Fungal Feature Tracker (FFT): purpose-built for filamentous fungi; extracts hyphal length, branching density, tip counts, and growth front velocity from time-lapse images.
- IncuCyte (Sartorius): live-cell imaging platform with time-lapse modules for microplate formats; available in UK research institutions. Captures growth curves automatically and exports area and confluence metrics.
Practical workflow:
- Capture images at a consistent resolution (minimum 1,200 dpi for colony plates; 2× or 4× objective for microplate wells).
- Apply background subtraction (rolling-ball algorithm in ImageJ or equivalent) to correct for uneven illumination.
- Convert to 8-bit greyscale and apply a threshold (Otsu’s method is a reliable starting point for most fungal images).
- Segment colonies or hyphal networks using the chosen tool’s particle analysis or skeleton functions.
- Validate segmentation on a subset of images by comparing automated area or length measurements with manual tracings.
- Export metrics to a spreadsheet or R/Python script for downstream growth-rate calculations.
Image-intensity-based models validated against DCW showed a strong correlation (R² = 0.941, p < 0.001) in a cultivated mycelium study, confirming that image analysis can serve as a reliable proxy when properly calibrated.
Pro Tip: When training a deep learning segmentation model with a small dataset, use data augmentation (rotation, flipping, brightness jitter) to expand effective training set size. Combine automated outputs with periodic DCW or ergosterol validation at three or more time points to confirm the model has not drifted.
The greatest experimental challenge with filamentous fungi is structural heterogeneity; objective image-based metrics replace subjective descriptors like “fluffy” and make phenotype comparisons reproducible across labs.
| Tool | Primary output | Throughput | Requires training data | UK availability |
|---|---|---|---|---|
| ImageJ/Fiji | Area, length, fractal dimension | Medium | No | Free download |
| CellProfiler | Multi-metric pipelines | High | No (pipeline config) | Free download |
| Fungal Feature Tracker | Hyphal metrics, tip counts | Medium | No | Free (academic) |
| IncuCyte | Area, confluence, time-lapse curves | High | No | UK lab instrument |
Pro Tip: For growth analysis on solid media, photograph plates at the same time of day to control for any diurnal variation in incubator temperature that might affect colony edge sharpness.
How do you calculate specific growth rate, doubling time, and radial growth rate?
Growth-rate calculations turn raw measurements into comparable, publishable metrics. Three values cover most experimental reporting needs.
Key metrics and their formulae:
- Specific growth rate (µ): µ (h⁻¹) = (ln X₂ − ln X₁) / (t₂ − t₁), where X is biomass (DCW or OD-derived) and t is time in hours. Calculate µ from the exponential phase only; including lag or stationary phase data underestimates the true growth rate.
- Doubling time (t_d): t_d (h) = ln(2) / µ = 0.693 / µ. A culture with µ = 0.1 h⁻¹ has a doubling time of approximately 6.9 hours.
- Radial growth rate ®: r (mm day⁻¹) = slope of the linear regression of mean colony radius against time (days). Use at least five time points spanning the linear expansion phase.
Worked example (OD time series to µ):
Suppose your OD-versus-DCW calibration gives DCW (mg mL⁻¹) = 4.2 × OD₆₀₀. You record OD₆₀₀ = 0.08 at t = 12 h and OD₆₀₀ = 0.22 at t = 24 h. Convert: X₁ = 0.336 mg mL⁻¹, X₂ = 0.924 mg mL⁻¹. Then µ = (ln 0.924 − ln 0.336) / (24 − 12) = (−0.079 − (−1.090)) / 12 = 1.011 / 12 ≈ 0.084 h⁻¹. Doubling time ≈ 8.3 hours.
Normalisation and replicate reporting:
- Normalise biomass to surface area (mg cm⁻²) for solid-substrate experiments or to initial inoculum mass for comparative studies.
- Report biological replicates (independent cultures) separately from technical replicates (repeated measurements on the same culture); a minimum of three biological replicates is standard.
- Express variability as standard deviation or standard error; include individual data points in figures wherever possible.
Recommended plots for publication:
- Growth curves: biomass or OD on the y-axis, time on the x-axis, with error bars for biological replicates.
- Standard curves: OD on the x-axis, DCW on the y-axis, with the regression equation and R² displayed.
- Boxplots or dot plots of endpoint biomass or growth rate across treatments.
- Colony diameter versus time plots with linear regression lines for radial growth experiments.
What practical steps keep your measurements reproducible and error-free?
Measurement error in fungal growth studies usually comes from a small number of predictable sources. Addressing them systematically before you start an experiment saves far more time than troubleshooting afterwards.
Common sources of error by method:
- OD: nonlinearity above the linear range; pellet settling between readings; pigmented media absorbing at the measurement wavelength.
- DCW: incomplete mycelium recovery during filtration; residual medium salts if washing steps are skipped; balance drift between weighings.
- Ergosterol: incomplete extraction if saponification time or temperature is insufficient; co-extraction of plant sterols from complex substrates; ergosterol degradation under UV light during processing.
- CFU plating: satellite colonies from airborne contamination; clumping causing underestimation; agar surface drying during long incubations.
- Image analysis: inconsistent lighting between sessions; autofluorescence from substrate material; thresholding errors at colony edges.
Sample handling SOP recommendations:
- Process all replicates within the same session to minimise batch effects.
- Randomise sample order during processing to prevent systematic positional bias.
- Include a reagent blank (medium without inoculum) and a positive control (a reference strain with known growth characteristics) in every experiment.
- Label samples with a code rather than treatment name during processing to allow blind measurement where feasible.
Equipment calibration checklist:
- Analytical balance: calibrate with certified weights at the start of each DCW session.
- Spectrophotometer: blank with the appropriate solvent or medium before each reading series; verify linearity monthly with a neutral density filter set.
- Imaging station: check pixel-to-mm calibration with a stage micrometre or ruler at the start of each imaging session; verify that illumination is even across the field.
Pro Tip: When adopting a new species or growth condition, run a small validation experiment comparing OD and DCW at three time points before committing to OD as your primary readout. This takes one extra day and prevents weeks of data that cannot be interpreted.
Contamination is one of the most common sources of spurious growth signals. The contamination in cultivation guide covers detection and mitigation strategies that apply equally to research cultures and production runs.
Side-by-side comparison of the main measurement methods
Selecting the right method comes down to matching its attributes to your experimental question. The table below covers the principal dimensions for each approach.
| Method | Sample type | Throughput | Accuracy / directness | Destructive | Key equipment | Time to result | Output units |
|---|---|---|---|---|---|---|---|
| Dry cell weight (DCW) | Liquid | Low | Direct (gold standard) | Yes | Balance, oven, filters | 24+ hours | mg mL⁻¹ |
| Ergosterol assay | Solid / embedded / liquid | Low | Direct biomarker | Yes | HPLC or spectrophotometer | 4–8 hours | mg g⁻¹ substrate |
| Chitin assay | Solid / embedded | Low | Direct biomarker | Yes | Spectrophotometer | 4–6 hours | µg glucosamine g⁻¹ |
| Radial growth / diameter | Solid agar | High | Indirect (2D proxy) | No | Calliper or camera | Minutes | mm day⁻¹ |
| OD / microplate | Liquid (dispersed) | High | Indirect (calibrated) | No | Plate reader | Minutes | OD units → mg mL⁻¹ |
| Haemocytometer count | Liquid (spores) | Medium | Direct count | No | Microscope | — | spores mL⁻¹ |
| CFU plating | Liquid / spore suspension | Medium | Viable count | Yes (culture) | Incubator, agar plates | 48–96 hours | CFU mL⁻¹ |
| ImageJ/Fiji / CellProfiler | Solid / liquid images | High | Indirect (validated) | No | Camera, computer | Minutes | mm², µm length |
| FFT / IncuCyte | Solid / microplate | High | Indirect (validated) | No | Imaging platform | Minutes | Area, tip count |
Matching lab goals to methods:
- Phenotype screening across many isolates: radial growth on agar or microplate OD with a shared calibration curve.
- Absolute biomass for metabolic or yield studies: DCW in liquid culture; ergosterol for solid or embedded substrates.
- Spatial growth analysis in 3D materials: ergosterol from spatially sampled cores.
- Inoculum standardisation: haemocytometer spore count before every experiment.
- Kinetic time-course in microplates: IncuCyte or microplate OD, validated against DCW at the start and end of the growth curve.
When no single method covers all your needs, hybrid approaches are the pragmatic answer. Pairing automated image analysis with periodic ergosterol or DCW validation at two or three time points gives you throughput without sacrificing confidence in the absolute values.
Key takeaways
Dry cell weight and ergosterol are the most accurate fungal biomass methods; OD and image analysis offer speed when calibrated to a direct measure.
| Point | Details |
|---|---|
| Match method to substrate | Use DCW or ergosterol for liquid or embedded substrates; use radial growth or OD for agar or dispersed liquid cultures. |
| Calibrate every indirect method | Build an OD-versus-DCW or image-versus-DCW standard curve for each species and morphology before collecting experimental data. |
| Validate periodically | Compare automated or OD-derived values against DCW or ergosterol at a minimum of three time points when adopting a new condition. |
| Report replicate structure | Use at least three biological replicates; report standard deviation or standard error and include individual data points in figures. |
| Invest in automation for scale | ImageJ/Fiji, CellProfiler, FFT, or IncuCyte reduce labour significantly for high-throughput screens and are freely available or accessible in UK research institutions. |
Useful sources
The sources below are the principal references underpinning the protocols and recommendations in this article. Those marked with a protocol note include stepwise methods suitable for direct laboratory implementation.
- Quantitative Monitoring of Mycelial Growth of Aspergillus fumigatus in Liquid Culture by Optical Density — stepwise OD calibration against DCW; directly implementable for liquid-culture monitoring.
- Quantifying fungal growth in 3D: an ergosterol-based method to distinguish growth modes — full ergosterol extraction protocol with recovery controls; covers spatial sampling for embedded substrates.
- A rapid and efficient method for growth measurement of filamentous fungi (MDPI Insects) — microplate OD and DCW comparison with calibration curve construction; includes entomopathogenic fungal examples.
- Automated image-based phenotyping and fungal feature quantification (mBio) — deep learning segmentation pipeline for 24-well plate assays; describes FFT outputs and validation approach.
- Rapid and concise quantification of mycelial growth by microscopic image intensity model (Scientific Reports) — image-intensity model validated against DCW (R² = 0.941); covers fractal analysis and mass cultivation applications.
- Inferring fungal growth rates from optical density data (PMC) — statistical framework for extracting growth rate parameters from OD time-series data.
- A high-throughput method for measuring fungal growth rate on solid media using automated imaging and deep learning (bioRxiv) — 24-well plate pipeline combining automated imaging with deep learning segmentation for solid-media phenotyping.
- Types of growth as related to rates — University of Texas mycology resource — foundational overview of measurable growth parameters and their relationship to biomass.
- Laboratory methods for measuring the growth rate of fungi — University of Mustansiriyah lecture notes — practical laboratory protocols covering radial growth, spore counts, and DCW.
Pro Tip: Sources 2 and 3 include the most directly implementable stepwise protocols. Start with these if you are setting up ergosterol extraction or microplate OD calibration for the first time.
For researchers sourcing standardised starting material for growth assays, Sporebuddies supplies mushroom spores and spore syringes for research and educational use across the UK, along with a full range of mycology equipment and supplies including agar plates, microscopes, and sterilised substrates.
FAQ
How do you measure fungal growth in the laboratory?
The most common approaches are dry cell weight for liquid cultures, radial colony diameter for solid agar, and ergosterol or chitin assays for embedded substrates. Optical density and automated image analysis are used for high-throughput time-course experiments when calibrated against a direct measure.
What is the most accurate method for quantifying fungal biomass?
Dry cell weight is the gold standard for liquid cultures because it measures actual biomass directly. For solid or complex substrates where mycelium cannot be separated, ergosterol quantification by HPLC is the most reliable alternative.
How do you calculate fungal growth rate from OD data?
Convert OD readings to biomass using a species-specific OD-versus-DCW calibration curve, then apply the specific growth rate formula: µ (h⁻¹) = (ln X₂ − ln X₁) / (t₂ − t₁), using only data points from the exponential growth phase.
When should you use CFU plating instead of OD or DCW?
CFU plating is most useful for quantifying viable spore concentration, standardising inocula, or assessing germination rates. It is less suited to measuring total biomass in filamentous fungi because hyphal clumping causes significant underestimation of viable unit numbers.
What is the linear range for OD measurements of fungal cultures?
For dispersed fungal cultures, OD at 600 nm is typically linear up to approximately 0.3–0.4 absorbance units. Above this range, dilute the sample and re-measure; pellet-forming morphologies require homogenisation before any OD reading can be trusted.